Understanding Paint Color Mixing Charts and Graphs
Navigating the world of paint colors can be overwhelming. The sheer number of available hues, shades, and tints is enough to make any artist or homeowner feel lost. Fortunately, paint color mixing charts and graphs offer a systematic approach to understanding color relationships and predicting the outcome of mixing different paints. These tools serve as invaluable resources for achieving desired colors accurately and efficiently, minimizing wasted paint and maximizing creative control.
Paint color mixing charts and graphs are visual representations of color theory principles, specifically focusing on how primary colors interact to create secondary and tertiary colors. These charts are not merely decorative; they are functional tools that allow individuals to anticipate the results of combining different pigments. By understanding the underlying principles depicted in these charts, users can effectively mix paints to achieve specific color goals, whether for artistic endeavors, interior design, or DIY projects.
The Foundation: Primary, Secondary, and Tertiary Colors
The basis of any color mixing chart lies in the understanding of primary, secondary, and tertiary colors. Primary colors are the fundamental colors that cannot be created by mixing other colors together. In the traditional subtractive color model used for paints, these primary colors are red, yellow, and blue. These colors serve as the building blocks for all other colors.
Secondary colors are created by mixing two primary colors. Red and yellow combine to create orange, yellow and blue combine to create green, and blue and red combine to create violet (purple). These secondary colors are positioned between their constituent primary colors on a color wheel, providing a visual representation of their relationship.
Tertiary colors are formed by mixing a primary color with a neighboring secondary color. Examples of tertiary colors include red-violet, red-orange, yellow-orange, yellow-green, blue-green, and blue-violet. These colors offer a more nuanced range of hues and contribute to the complexity and subtlety of color palettes. The color wheel, often incorporated into color mixing charts, visually displays these relationships, making it easier to understand how different colors relate to one another.
Beyond the basic color wheel, understanding the properties of each color is crucial. Hue refers to the pure color itself (e.g., red, blue, green). Saturation describes the intensity or purity of the color; a highly saturated color is vibrant and vivid, while a low saturation color is muted or dull. Value refers to the lightness or darkness of a color; adding white increases the value (creating a tint), while adding black decreases the value (creating a shade).
Understanding Color Mixing Charts
Color mixing charts come in various formats, but they generally share common features. One common type is a grid or matrix, where each axis represents a different color. Where the colors intersect on the grid, the resulting mixed color is displayed. This allows users to quickly see the outcome of combining different paint colors in specific proportions.
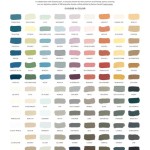
Another type of chart is a color wheel-based chart, which expands on the standard color wheel by showing the effects of adding white, black, or gray to each color. This helps users understand how to create tints, shades, and tones of specific colors. These charts often include detailed instructions on the proportion of each color needed to achieve the desired result.
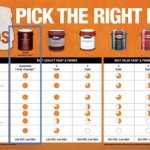
When interpreting a color mixing chart, it's important to consider the quality of the paints being used. The pigment composition, opacity, and transparency of each paint can significantly affect the outcome of the mixture. High-quality pigments tend to produce cleaner, more predictable results, while lower-quality pigments may result in muddier or less vibrant colors. Therefore, it’s generally recommended to use artist-grade paints for optimal color mixing results.
Furthermore, the type of paint also matters. Acrylic paints, oil paints, and watercolor paints have different properties that influence how they mix and dry. Acrylics dry quickly and are water-based, while oils dry slowly and require solvents for clean-up. Watercolors are transparent and are best used for layering and glazing techniques. Each type of paint requires different mixing techniques and considerations to achieve the desired results.
The proportions of each color used in the mix are also critical. Even slight variations in the amounts of each paint can significantly alter the final color. It is advisable to start with small amounts of each color and gradually add more until the desired hue is achieved. Keeping accurate records of the proportions used can help replicate the color in the future.
Using Color Mixing Graphs for Precise Results
Color mixing graphs take the principles of color mixing charts a step further by providing a more precise and quantifiable approach to color mixing. These graphs often use numerical values to represent the proportions of each color needed to achieve a specific target color. This level of precision is particularly useful for applications that require consistent and repeatable color results, such as manufacturing, printing, and digital design.
One common type of color mixing graph is a triangular graph, also known as a ternary plot. This type of graph is used to represent mixtures of three components, typically three primary colors. Each corner of the triangle represents one of the primary colors in its pure form, while the points within the triangle represent different mixtures of the three colors. The closer a point is to a corner, the higher the proportion of that primary color in the mixture.
To use a triangular graph, one must first identify the target color and then locate the corresponding point on the graph. The coordinates of that point indicate the proportions of each primary color needed to achieve the target color. These proportions can then be used to guide the paint mixing process, ensuring accurate and consistent results.
Software applications and online tools also provide sophisticated color mixing graphs and calculators. These tools often incorporate advanced color models, such as RGB, CMYK, and LAB, to provide even greater precision and control over color mixing. These models allow users to specify colors using numerical values for each component, making it easier to achieve the desired color accurately.
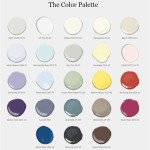
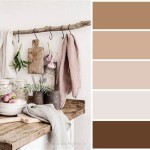
Color mixing graphs are particularly useful for creating custom color palettes. By plotting the desired colors on a graph, users can visualize the relationships between the colors and identify potential harmonies or contrasts. This can help to create visually appealing and cohesive color schemes for various applications.
When using color mixing graphs, it's essential to consider the limitations of the color model being used. Different color models have different gamuts, which refer to the range of colors that can be accurately represented. Some colors that can be displayed on a computer screen may not be reproducible using physical paints, and vice versa. Therefore, it's important to choose a color model that is appropriate for the medium being used.
In addition to understanding the principles of color theory and pigment mixing, practical experience is essential for mastering the art of color mixing. Experimenting with different paint colors and proportions, and keeping detailed records of the results, can help to develop a strong intuition for color mixing and improve accuracy over time. This hands-on experience, coupled with a solid understanding of color mixing charts and graphs, empowers individuals to achieve their desired color outcomes with confidence and precision.

Richard Schmid S Color Chart Exercise Saved My Art Career

Color Mixing Chart Natural Earth Paint

Mixing Colors A Detailed Guide On Paint

Richard Schmid S Color Chart Exercise Saved My Art Career

Magic Palette Color Mixing Guide

Color Mixing Guide Golden Artist Colors

Acrylic Color Mixing Chart Free Draw And Paint For Fun

5 Types Of Watercolor Charts Type 4 Color Mixing Chart Susan Chiang

The Dimensions Of Colour Mixing In Paints

How To Make Color Mixing Charts Daniel Smith Artists Materials
Related Posts